









Teaser: Revenue of a business can rise even while its gross margin falls. Margin waterfall analysis shows what contributes to changes in gross margin-whether its volume, product mix, pricing, cost, promotions, markdowns or other factors-and when and where management should act.
What is in this article:
- Executive summary
- Introduction
- What is margin waterfall analysis?
- Why headline gross margin does not tell the whole story
- Margin waterfall vs price waterfall: what is the difference?
- What are the main drivers in a gross margin waterfall?
- A simple margin waterfall example
- Gross-profit value vs margin percentage
- How can our business build a margin waterfall analysis?
- What are common margin waterfall analysis mistakes?
- Performing a margin waterfall analysis in Excel: useful but difficult to scale
- Margin waterfall analysis helps companies be competitive
- How MODLR supports margin waterfall analysis
- From margin reporting to margin management
- Frequently asked questions (FAQ's)
- Conclusion
- Turn margin insights into action with MODLR
Executive summary
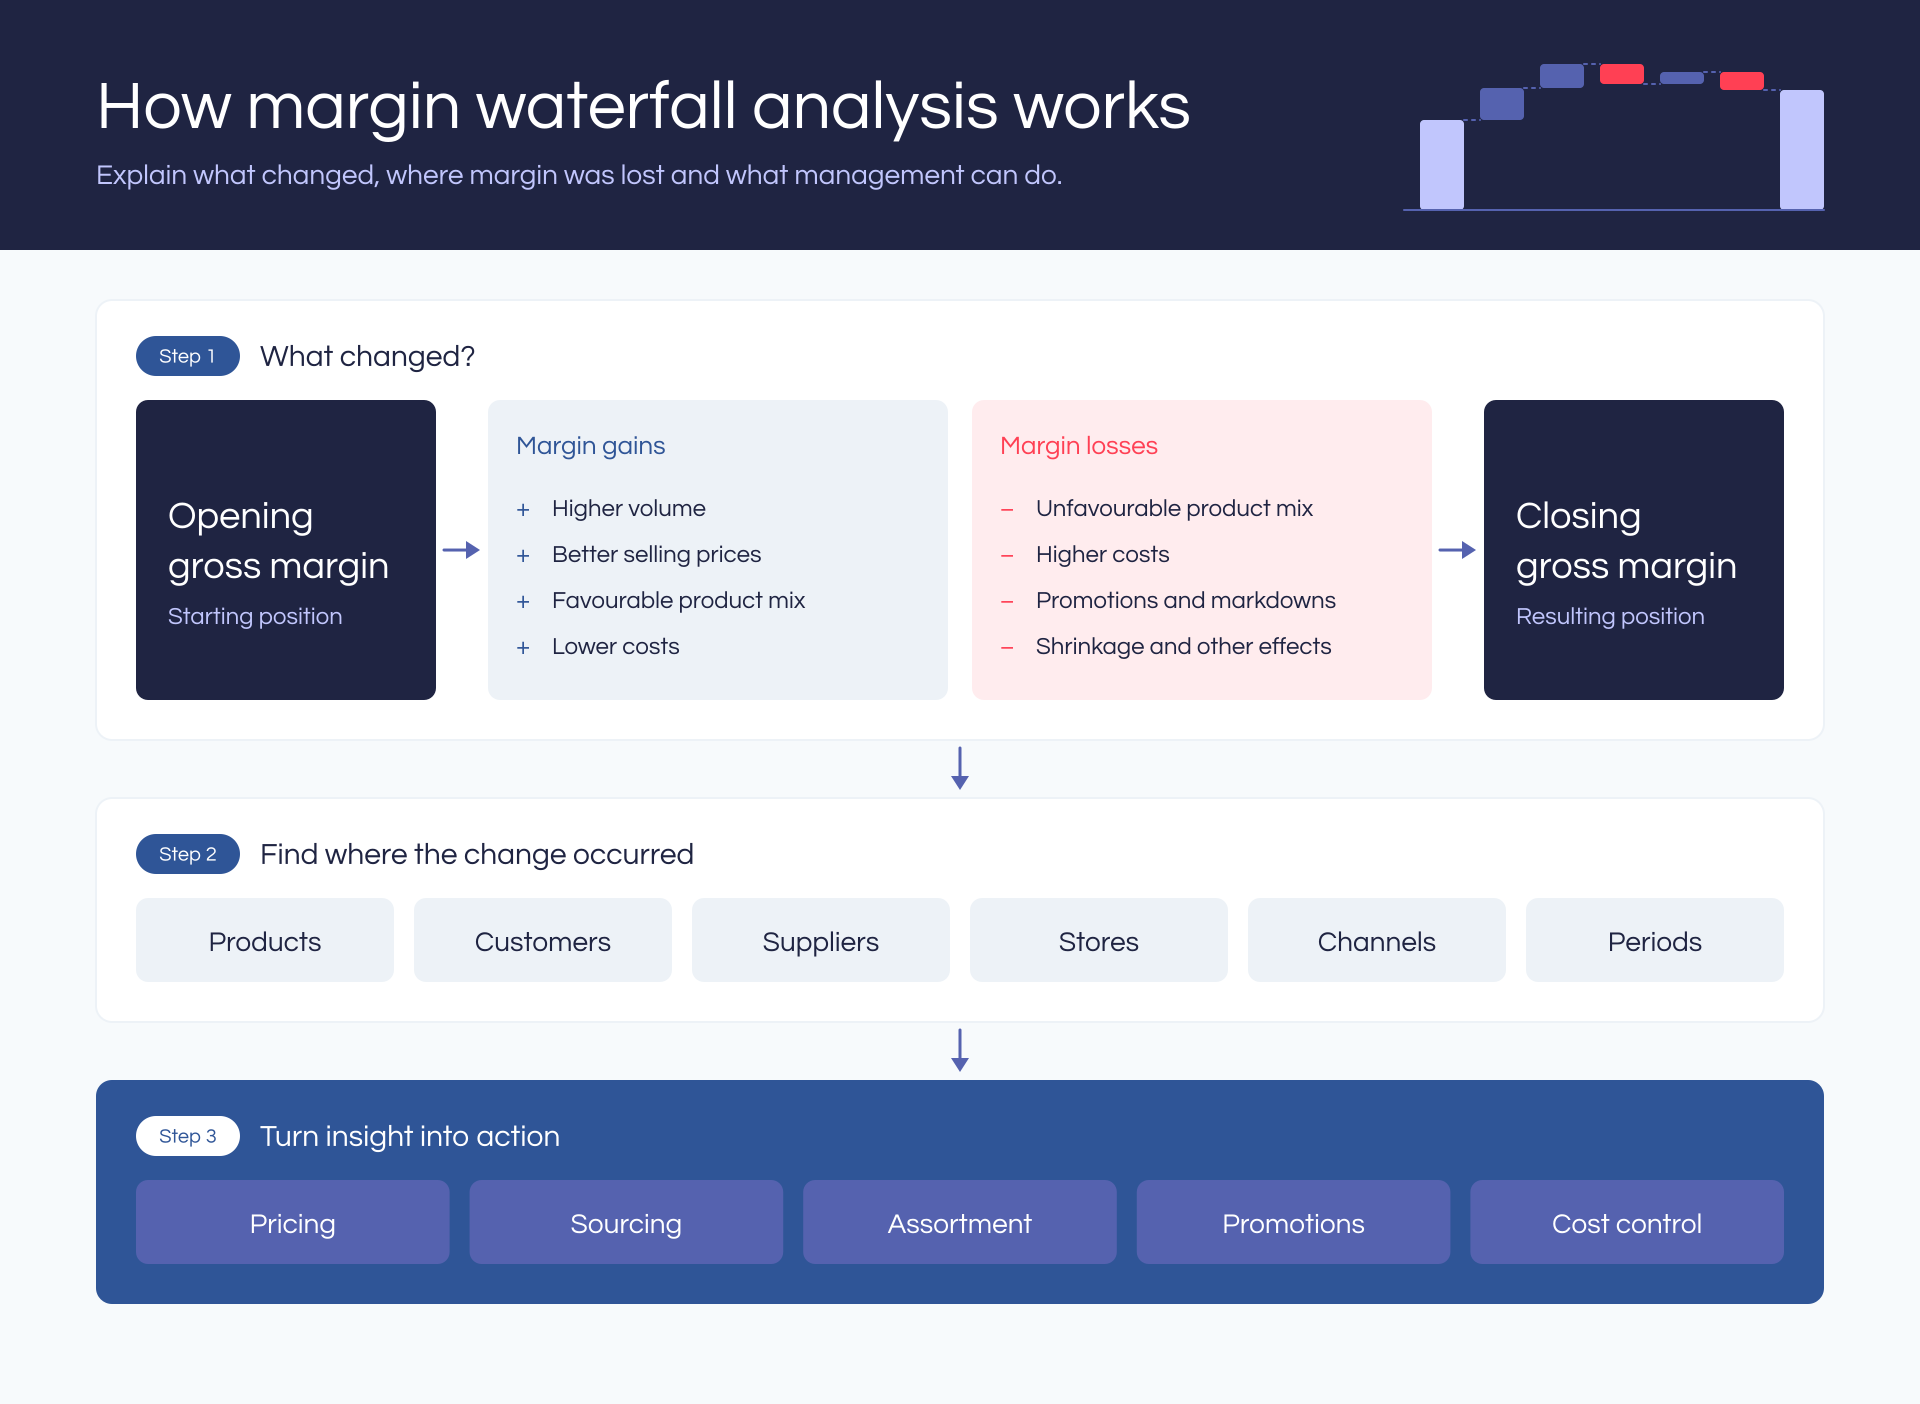
Margin waterfall analysis explains the movement between an opening gross margin and a closing gross margin for a period, and separates the impact of those change into its underlying drivers. Businesses don’t need to settle for knowing whether their profit margin increased or decreased. They can an use margin waterfall analysis to figure out how the combined effect of volume, product mix, selling prices, input costs, markdowns, promotions, shrinkage and other commercial factors contributed to the change.
Without the details that a margin waterfall analysis highlights, the headline result can be misleading.
For example:
- Revenue may grow even as gross margin declines.
- A price increase may seem effective, but fail to recover higher costs.
- Strong unit growth is not a cause for celebration if it is concentrated in lower-margin products.
- Promotions may lift sales without creating enough incremental gross profit.
A well-designed margin waterfall gives finance and management a shared explanation of what changed, and where margin is being gained or lost.
The next step is to figure out which actions are most likely to improve the result, going forward.
With MODLR’s Margin Waterfall Analysis, organisations can analyse these effects across products, categories, suppliers, customers, stores, channels, entities and periods within a connected planning environment.
Introduction
Gross margin of a business can change adversely even while revenue continues to grow. Higher costs, a weaker product mix, increased discounting, markdowns or shrinkage can offset the benefits of stronger sales volumes and improved pricing.
Margin waterfall analysis helps businesses look beyond the headline result and identify the factors driving business performance. By knowing where margin is being gained or lost, business and sales leaders can improve their pricing, sourcing, product mix, promotions and control costs.
What is margin waterfall analysis?
Margin waterfall analysis is a method of reconciling the difference between gross margin in one period or scenario and gross margin in another.
The analysis normally begins with an opening value-such as last year's actual gross profit, the current budget or the previous forecast-and ends with a closing value, such as this year's actual gross profit or a revised forecast. The steps between the two values quantify the effect of various environmental, commercial and operational drivers that led to the change.
Margin waterfall analysis can form part of a broader period-end or month-end variance analysis by explaining the commercial drivers behind the reported gross margin variance.
A typical margin waterfall may take into account the changes in the following:
- Volume
- Product or customer mix
- Selling price
- Product or input cost
- Foreign exchange
- Promotions and discounts
- Markdowns
- Rebates or supplier funding
- Shrinkage, waste or spoilage
- New and discontinued products
- Other defined business effects
The result is also known as a gross margin bridge, margin bridge analysis or gross margin variance waterfall. The terminology varies, but the management question is the same:
Why did gross margin change, where is margin being gained and lost, and what can the business do about it?
Why headline gross margin does not tell the whole story
Gross profit is calculated as:
Gross profit = Revenue − Cost of goods sold
Gross margin percentage is calculated as:
Gross margin % = Gross profit ÷ Revenue × 100
These measures show the outcome. But they do not explain the cause.
Let us take an example:
Suppose the revenue of a business increases by 8% over the previous period, but their gross profit declines.
Several different factors could have contributed to the ultimate result:
- The business sold more units, but growth came from lower-margin products.
- Prices increased, but not enough to recover higher input costs.
- Promotions generated revenue but reduced gross profit per unit.
- Customers shifted to lower-priced packs or channels.
- A favourable sales mix in one region concealed margin leakage in another.
- Shrinkage, waste or markdowns increased.
Each explanation points to a different response.
- A pricing problem may require new price architecture or tighter discount controls.
- A mix problem may call for changes to assortment, sales incentives or channel strategy.
- A cost problem may need looking into sourcing, supplier negotiation, product redesign or operational action.
Without the bridge between the opening and closing values that a margin waterfall analysis provides, management can only see the symptom. They are unable to see the commercial mechanism behind it and cannot take meaningful corrective action.
Providing those critical details is the role of the margin waterfall analysis.
Margin waterfall vs price waterfall: what is the difference?
You may here these terms sometimes used interchangeably, but they answer different questions.
The price waterfall is commonly used to analyse price realisation and discount leakage. Bain & Co. for example define pricing waterfalls using transactional levers and the list, net and final price a company wants to realise. Their research also explains why discounts need to be analysed by product, geographies and customer segments, rather than as one undifferentiated total.
A margin waterfall is much wider. It can include price realisation, but also shows the impact of volume, mix, cost and other changes on gross profit.
The two analyses are symbiotic: the price waterfall shows how leakage occurs between list price and realised price; the margin waterfall shows how price and other levers combine to impact profitability.
What are the main drivers in a gross margin waterfall?
Gross margin waterfall is driven by the combined effects of:
- Volume
- Product
- Customer or channel mix
- Selling price
- Cost
- Promotions and discounts
- Markdowns
- Shrinkage, waste and spoilage
- And other business specific events
Here’s how they work:
A. Volume effect
The volume effect measures the impact of selling more or fewer units, holding the selected base margin per unit constant.
In simple terms:
Volume effect = Change in quantity × Base gross profit per unit
Positive gross-profit contribution from higher volume is normal when unit margin is positive. Volume growth does not necessarily mean good margin growth. If more units come from products, customers or channels with lower margins, the positive volume effect can be swamped by negative mix effect.
B. Product, customer or channel mix effect
The mix effect measures the profitability impact of changes in the composition of sales.
For example, total unit sales may remain unchanged while customers shift from premium products to economy products. Revenue and gross margin can fall even though overall volume is stable.
The same issue may arise when sales move:
- From high-margin to low-margin products
- From direct sales to lower-margin distribution channels
- From full-price to promotional sales
- From higher-margin customers to customer accounts with heavier discounts or service costs
- Between stores, regions, pack sizes or brands with different economics
This is especially relevant to retail and FMCG sales planning because fluctuations in demand, high SKU breadth, promotions and volatile customer behaviour can shift the sales mix rapidly. This means using margin analysis in retail and FMCG sales forecasting can help identify and explain how changes in sales mix influence not only sales results, but profitability as well.
Channel mix is typically the most valuable effect to separate out, because it explains why aggregate price and volume data can be so deceptive. Bain's 2026 study of the FMCG market in China, for example, concluded that potential like-for-like price increases could be offset by consumers buying less (changing volume), changing channels (product) and switching to lower priced products.
C. Selling-price effect
The selling-price effect measures the change in gross profit caused by a change in the realised selling price, separate from changes in units sold.
Here’s a simplified calculation:
Price effect = Current-period quantity × Change in net selling price per unit
Ideally, the analysis should be based on the price the business realises, after relevant discounts, and not just a list price. It can also be helpful to separate base-price changes from promotional discounts, rebates and other deductions so management can see whether improved pricing discipline or reduced discounting created the benefit.
D. Cost effect
The cost effect measures the change in gross profit caused by movement in unit cost.
A simplified calculation is:
Cost effect = Current-period quantity × Change in unit cost × −1
An increase in unit cost creates a negative margin effect unless it is recovered through price, mix, productivity or another benefit. Depending on the business, cost movements may be separated into:
- Raw materials or merchandise cost
- Manufacturing conversion cost
- Freight and logistics
- Labour
- Energy
- Supplier terms
- Import duties
- Foreign exchange
Separating these effects helps management distinguish market-driven cost pressure from sourcing, procurement or operational performance.
E. Promotion and discount effect
Promotions and discounts can boost demand. However, the growth in revenue does not demonstrate they created value. The analysis needs to measure the margin surrendered and the incremental volume or customer behaviour received in return.
This becomes critical when there are multiple overlapping programmes. When promotions and discounts are taking plance over a large range of products and variants, businesses may find it difficult to understand which investments are driving incremental profit, and which ones are destroying value.
In this case, a segmental analysis can isolate the effect by customer, product, geography or programme.
F. Markdown effect
Markdowns decrease the selling price of an inventory item, typically to liquidate old, seasonal or slow-moving stock. While often commercially necessary, they should be visible as a separate margin effect rather than be aggregated into an average selling price.
Drilling down on markdowns by product, category, store, season or buyer can reveal whether the issue lies in forecasting, assortment, purchasing, allocation, pricing or inventory management.
G. Shrinkage, waste and spoilage effect
Shrinkage, damage, expiry, waste and spoilage decrease the gross profit realized from purchased or produced inventory. While these impacts can be relatively minor when viewed in the aggregate, they can translate into material store, category, plant or period level effects.
By making them visible, businesses can link the reported margin outcome to operational drivers and responsible teams.
H. Other business-specific effects
Not every organisation has the same waterfall. Other useful components that may erode or boost margins include:
- Foreign-exchange movements
- Supplier rebates and funding
- Freight recovery
- Product launches and discontinuations
- Acquisitions or divestments
- Changes in transfer pricing
- Changes in accounting treatment
- One-off inventory adjustments
The aim is not to create the longest possible bridge. It is to define a set of drivers that is mathematically complete, consistently calculated and useful for decisions.
A simple margin waterfall example
Assume a business produced the following results:
Revenue increased, but gross profit declined by $200,000. A margin waterfall could explain the movement as follows:
Here’s what the margin waterfall looks like:
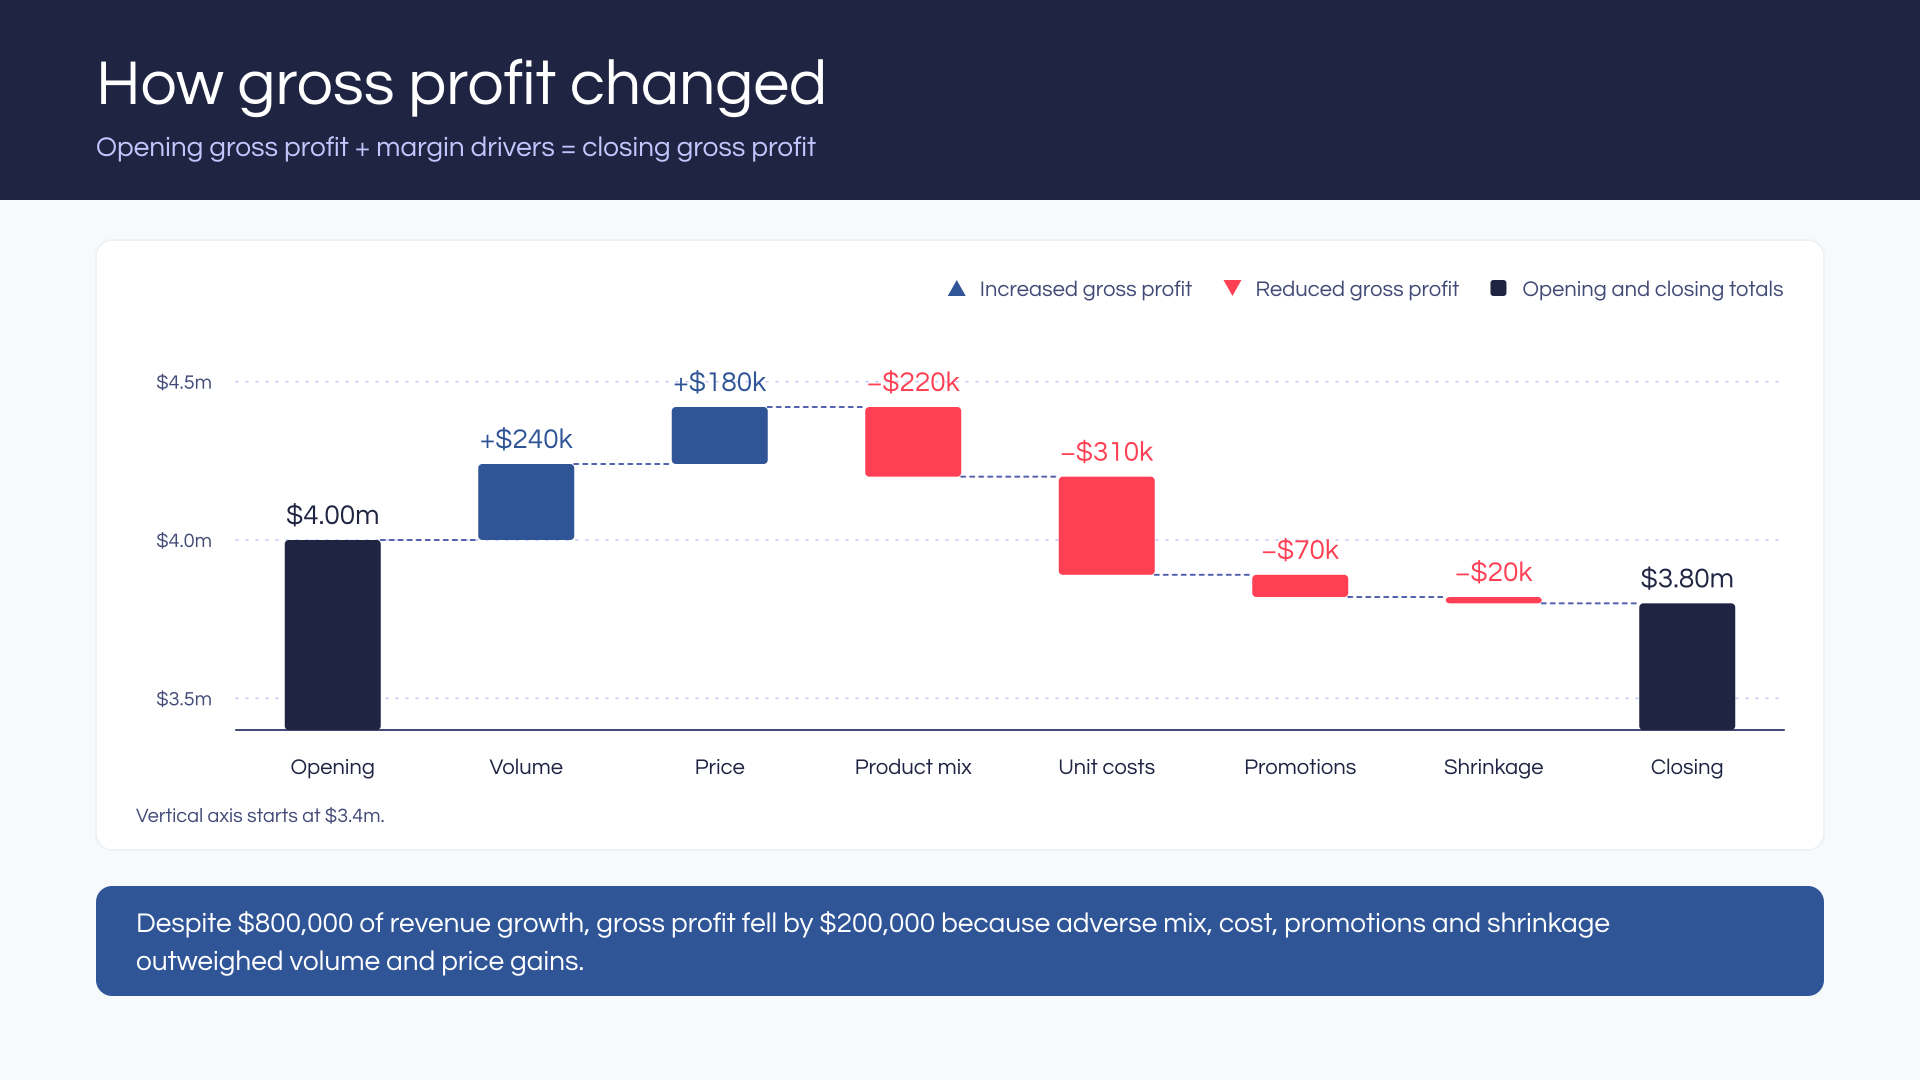
With the margin waterfall, the headline story ceases to be simply “revenue is up and margin is down.” You can see there is more to it.
The bridge shows that volume and price added $420,000, but the benefit was more than offset by an adverse mix, cost, promotional and shrinkage effects that total up to $620,000.
That explanation leads to more useful questions:
- Which products or channels caused the negative mix effect?
- Were price increases applied to the products experiencing the largest cost increases?
- Did promotional activity create enough incremental volume to justify the margin surrendered?
- Which suppliers or cost components caused the cost increase?
- Is shrinkage concentrated in particular locations or categories?
The waterfall does not make the decisions. Management has to make decisions based on the economic trade-offs highlighted and made visible by the analysis.
Gross-profit value vs margin percentage
A margin waterfall can be expressed in money terms (currency), margin percentage points or both. These views are related, but they are not interchangeable.
Gross-profit-value bridge
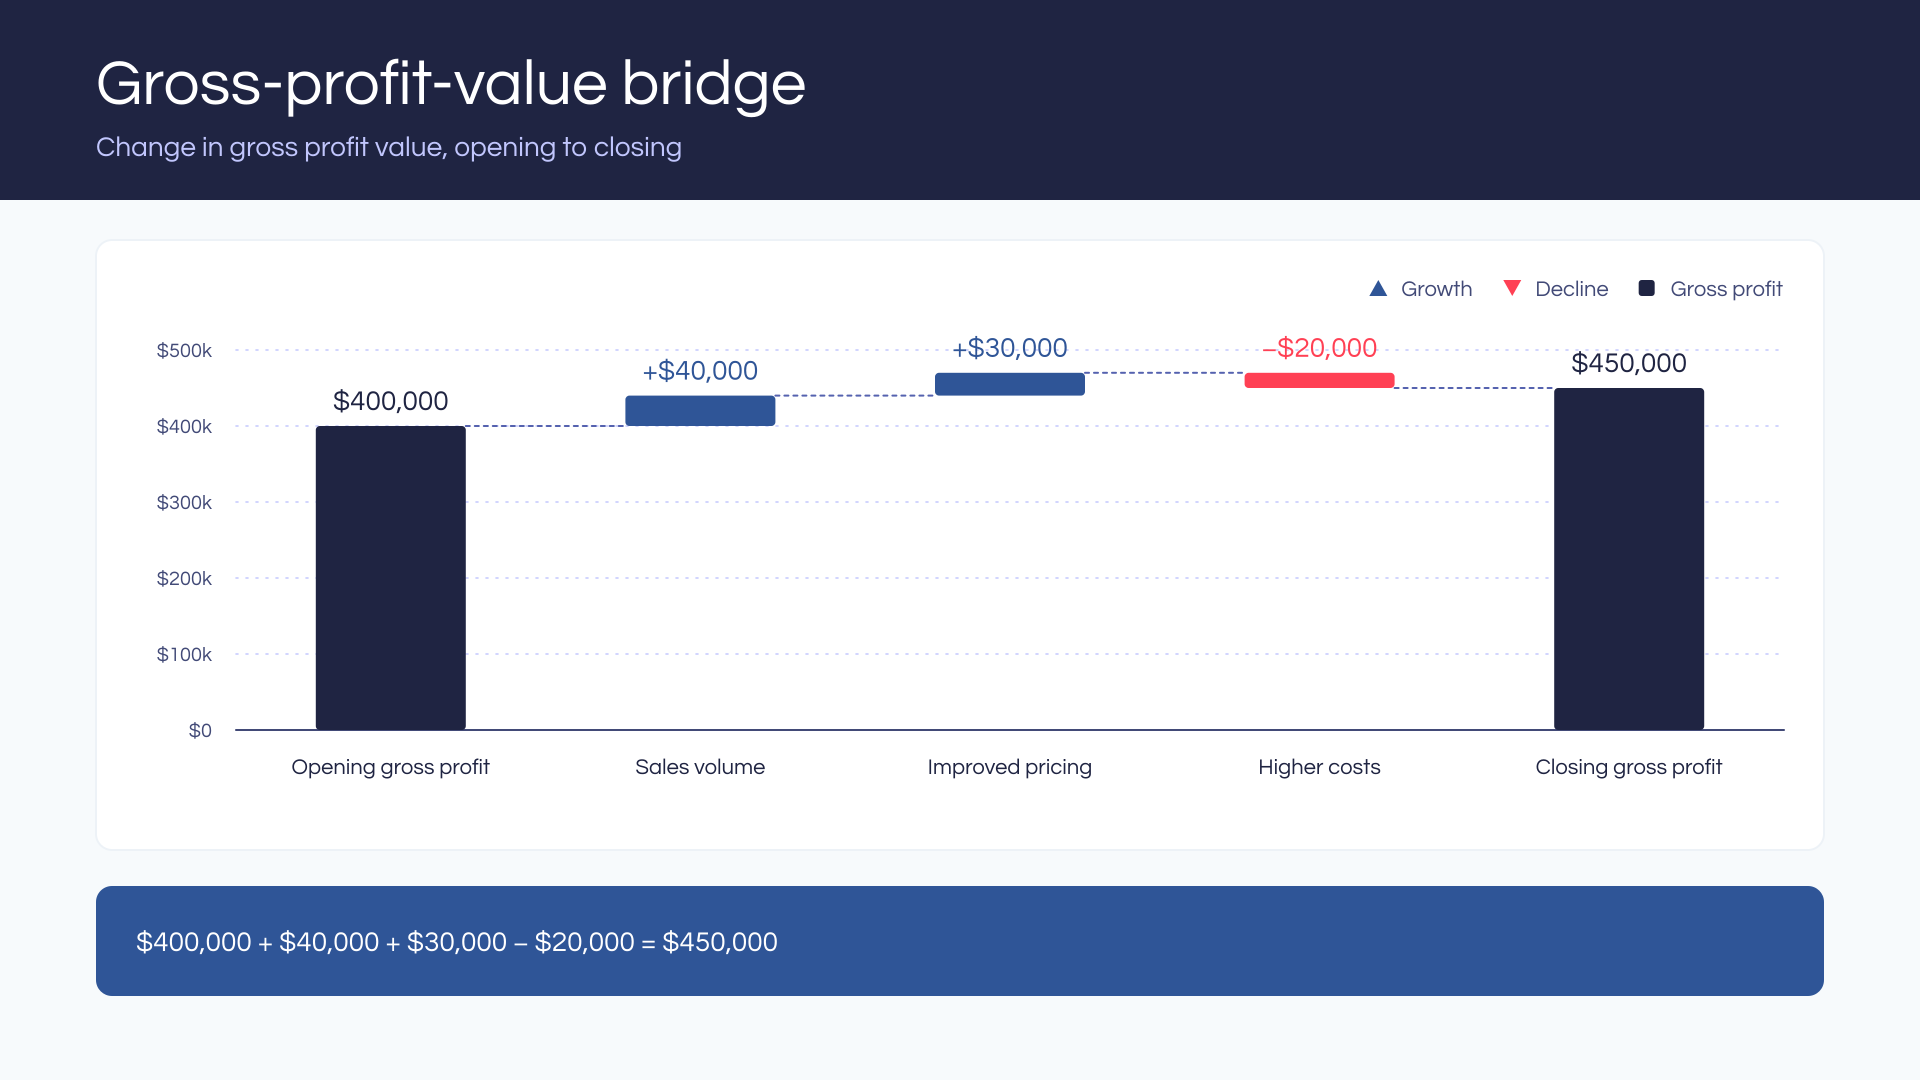
A gross-profit-value bridge explains the change in gross profit dollars. It is usually easier to reconcile directly and shows the financial value created or lost by each driver.
Here’s an example:
Business A’s gross profit increases from $400,000 to $450,000. The bridge shows that higher sales volume added $40,000, improved pricing added $30,000 and higher costs reduced gross profit by $20,000.
So the calculation and the gross profit value bridge is:
$400,000 + $40,000 + $30,000 − $20,000 = $450,000
Margin-percentage bridge
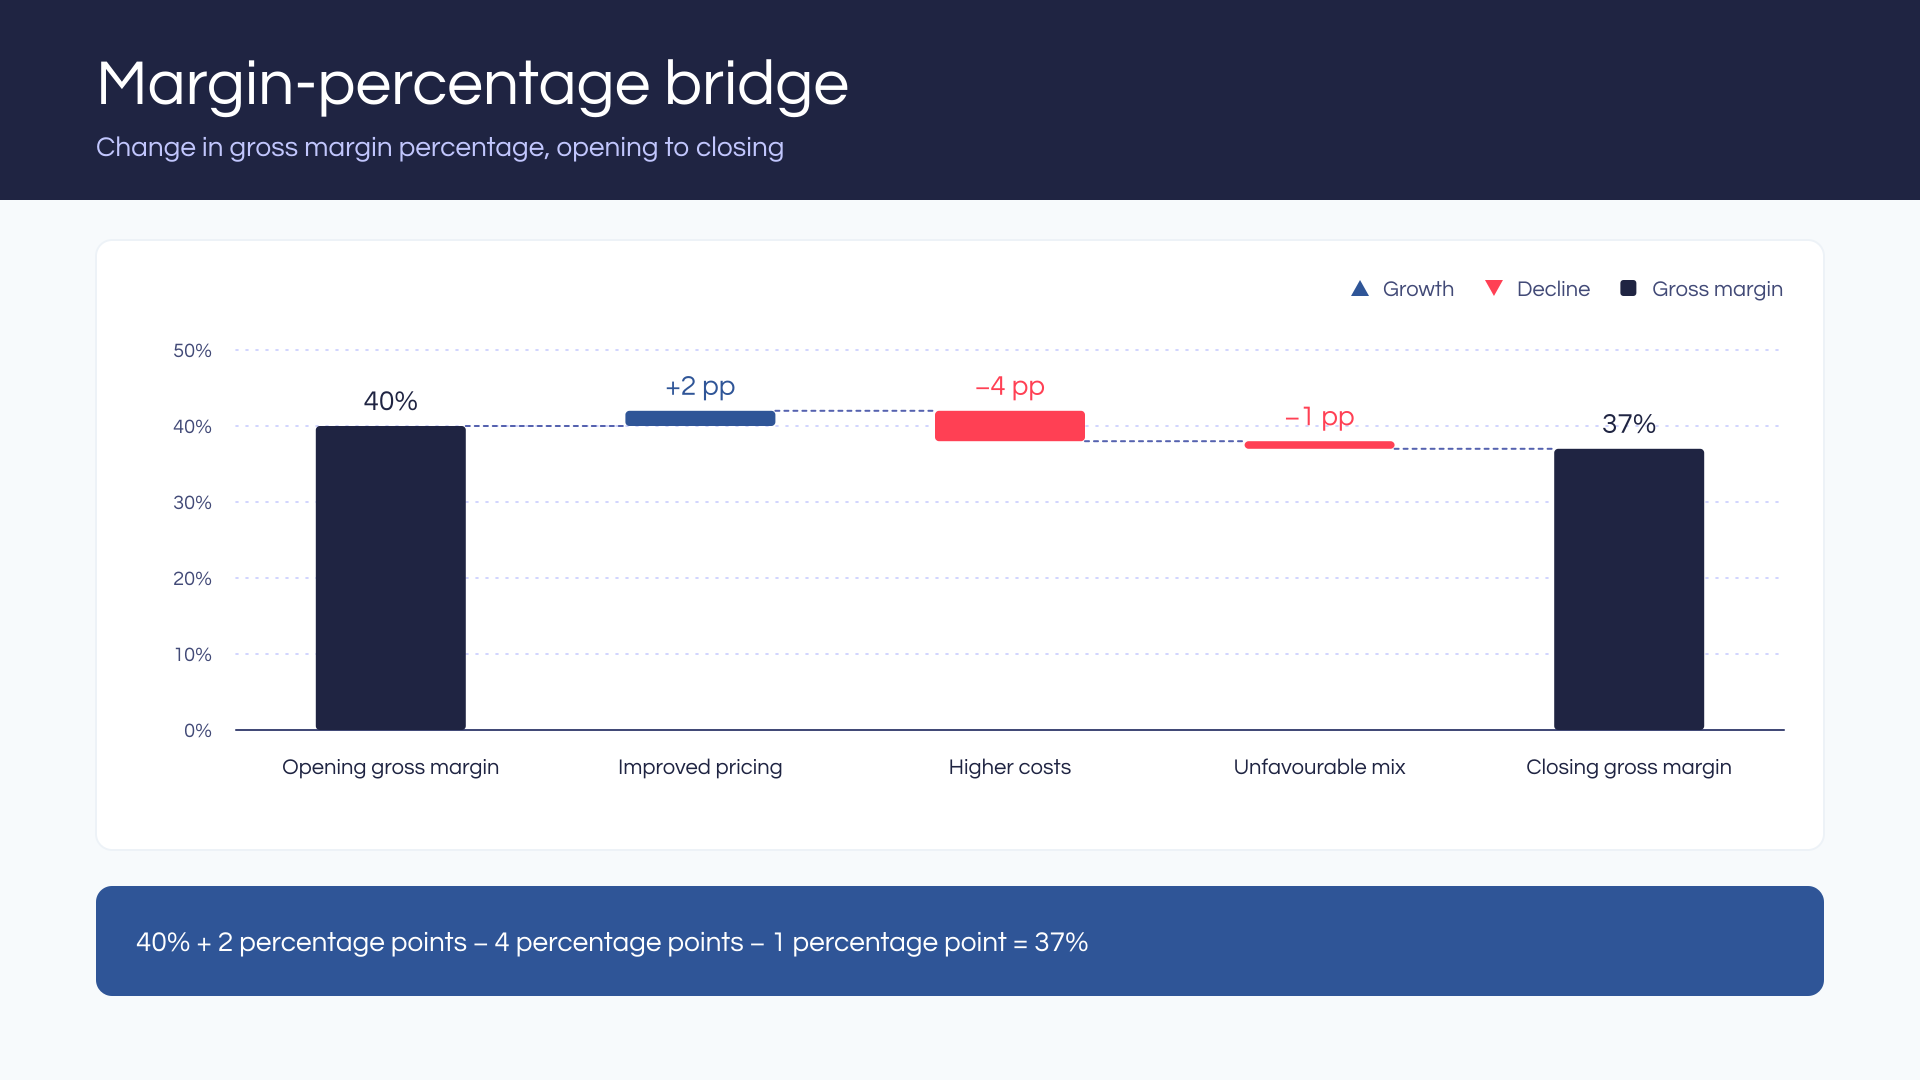
A margin-percentage bridge explains the change in gross margin rate. It is useful when management needs to understand profitability independent of the scale of revenue. But the treatment of volume and mix requires care because the revenue denominator also changes.
Here’s an example:
Business B’s gross margin falls from 40% to 37%. The bridge shows that improved pricing added 2 percentage points, while higher costs reduced margin by 4 percentage points and an unfavourable product mix reduced it by 1 percentage point.
So the calculation and the margin percentage bridge is:
40% + 2% − 4% − 1% = 37%
Which should our business choose, gross-profit-value bridge or margin-percentage bridge?
It is a good idea to calculate both because they answer different management questions.
- Gross-profit-value bridge shows the actual financial value created or lost by your business. It is easier to reconcile with the income statement and helps management prioritise actions according to monetary impact.
- Margin-percentage bridge shows whether profitability is improving or weakening relative to revenue. It allows comparisons across products, stores, business units or periods of different sizes.
For example, a large product category may create the greatest gross-profit increase simply because of its scale, while a smaller category may deliver a stronger margin percentage. If you only look at one measure, you will only see an incomplete picture.
The gross-profit-value bridge should normally be the primary analysis because it reconciles directly to reported gross profit. Use the margin-percentage bridge alongside it to assess the quality and efficiency of that profit.
In short:
- Gross-profit value shows how much was gained or lost.
- Margin percentage shows how profitably revenue was generated.
How to prepare for calculating a margin waterfall analysis?
Here’s what you must define before you build the analysis:
- Whether the bridge measures gross profit value, gross margin percentage points or both
- Which period, budget or forecast provides the base values
- Which quantity is used for each effect
- How new and discontinued products are to be treated
- How mix is calculated
- The order of price, volume, mix and cost effects
- How interaction or residual effects are to be allocated
- The level of rounding permitted
Keep in mind that different methods may treat overlapping effects differently. The important thing is choosing a method, documenting it and applying it consistently across periods and business units.
How can our business build a margin waterfall analysis?
A business can build a margin waterfall analysis using the following steps:
Step 1. Define the comparison
Choose the opening and closing positions. Common comparisons include:
- Actual vs prior year
- Actual vs budget
- Actual vs forecast
- Forecast vs previous forecast
- One store, entity, customer or channel vs another
- One scenario vs another
The comparison should be aligned to the decision management is trying to make.
Step 2. Establish consistent data
You need to bring together the quantities, realised prices, product costs, discounts, promotions and other inputs for both positions. Make sure that product, customer, supplier and organisational hierarchies align across the comparison.
Common data problems you encounter will include changes to product codes, missing cost records and inconsistent units of measure. Retrospective rebates, timing differences and new or discontinued items can also create problems during the analysis. Be sure to resolve these issues or explicitly classify them before presenting the bridge.
Step 3. Define the drivers and calculation rules
Use your judgement and decide which effects will be shown and how each will be calculated. The bridge must reconcile:
Opening gross profit + Sum of all driver effects = Closing gross profit
Investigate any unexplained residual balances instead of bundling them in a broad “other” category without review.
Step 4. Calculate at the lowest useful level
Aggregate calculations can hide important movements. Where the data permits, first calculate the effects at product, SKU, customer, store or transaction level. You can then aggregate them through the relevant hierarchies.
This preserves differences in unit economics and makes it possible to drill-down on details later, if needed.
Step 5. Analyse the result across dimensions
The total waterfall explains what happened overall. Management will want to know where it happened.
Useful views could include:
- Product, SKU, brand and category
- Customer and customer segment
- Supplier
- Store, branch, region and country
- Sales channel
- Business unit and legal entity
- Promotion, campaign or sales representative
- Week, month, quarter and year
This is where a multidimensional model becomes especially valuable. Finance can analyse the same margin result across products, customers, suppliers, stores, channels, entities and periods thanks to MODLR data cubes.
Here’s why multidimensional analysis matters:
A negative $300,000 cost effect at group level may be driven by one supplier, category or region. A favourable total price effect may coexist with discount leakage in selected customer groups. The details empower the decisionmakers, guiding them towards the corrective action. Without margin waterfall analysis, the decisions would be based on guess work, and nothing more.
Step 6. Separate recurring and one-off effects
A temporary inventory adjustment does not require the same response as continuing input-cost inflation. It is better to separate structural, recurring, timing and exceptional effects so that management does not build a plan around a movement that will reverse later.
Also, separating recurring and one-off effects helps management avoid the risk of ignoring a likely persistent effect.
Step 7. Convert the analysis into actions
The best course of action is to assign different material effects to the teams that are able to influence them.
For example:
The analysis becomes valuable when it changes pricing, sourcing, assortment, promotion, inventory or sales decisions.
What are common margin waterfall analysis mistakes?
Margin waterfall analysis is only useful when its data, calculations and interpretation are reliable. Avoiding the following common mistakes will help you produce accurate explanations of margin movements. The results will help turn your findings into meaningful action.
- Treating revenue growth as proof of margin improvement. Revenue can rise while gross profit or margin percentage falls. Always connect the revenue explanation to price, unit economics and cost.
- Combining price and mix. Average selling price can change because prices changed or because customers bought a different mix of products. Combining these effects may lead management to attribute the outcome of a pricing decision for what was actually a result of movement in the product mix..
- Using list price instead of realised price. If discounts, rebates or promotions affect the amount received, using list price alone results in overstating the economics of the sale.
- Calculating only at an aggregate level. Group averages may conceal product, customer and channel differences. It is better to calculate at the lowest reliable level and then aggregate from there.
- Allowing “other” to become material. A large residual weakens trust in your analysis. Instead, you should define tolerances, investigate unexplained movements and refine the model as and when new causes are identified.
- Changing the methodology between periods. If you change the order of effects, base quantities or treatment of interactions, the resulting trends may reflect methodology rather than actual business performance.
- Stopping at the chart. A margin waterfall is just an explanation, not an action plan. But, where necessary, it should lead way to meaningful action. Material effects should lead to decisions, scenarios and follow-up measures to recover lost margins.
Performing a margin waterfall analysis in Excel
In short, we can say it is useful but difficult to scale. Excel can be suitable for an initial or narrowly scoped margin bridge. It is possible to create calculations, validate the methodology and test the presentation before expanding the analysis.
The challenge arises when the bridge must be refreshed frequently or analysed across thousands of products, customers, suppliers, stores and periods.
If you use spreadsheet-based processes, your finance team will need to:
- Extract and combine data from several systems
- Maintain complex formulas and mappings
- Reconcile changing product and organisational hierarchies
- Manage versions of the analysis
- Rebuild charts for different management views
- Investigate formula or input errors
- Repeat the same process each month
As the analysis becomes more detailed, the spreadsheet will eventually turn into a static reporting exercise. Purely due to its complexity, it may cease to be a reusable management process. This is a common sign that finance has begun to outgrow spreadsheet-based FP&A.
Margin waterfall analysis helps companies be competitive
Margin waterfall analysis helps companies compete on profitable growth by showing how their sales volume, product mix, selling price, costs, promotions, and other factors affect gross margin. This helps firms respond faster to changes, reduce margin leakage and make more effective, forward-looking decisions.
Respond faster to price and cost changes
The analysis shows whether price increases are sufficient to recover higher costs and where further pricing, sourcing or operational action is needed. McKinsey identifies margin waterfall analysis as a useful way to assess and prioritise pricing opportunities.
Focus on profitable growth
Revenue growth can weaken margins when additional sales come from lower-margin products, customers or channels. MODLR Margin Waterfall Analysis solution helps companies compare margin drivers across products, categories, suppliers, stores and periods. It supports better pricing, assortment and resource-allocation decisions.
Reduce margin leakage
Separating the effects of discounts and promotions helps companies identify which activities help create incremental profit and which end up destroying value. Bain recommends analysing these investments across products, geographies and customer segments to improve their returns.
Make better forward-looking decisions
Once margin drivers are understood, businesses can use scenario planning to test changes to pricing, suppliers, product mix, promotions and markdowns before implementation. Scenario analysis of potential decisions is particularly helpful for strategically dealing with uncertainty.
Overall, margin waterfall analysis helps companies act faster, allocate resources more effectively and compete on sustainable profitability rather than revenue growth alone.
How MODLR supports margin waterfall analysis
MODLR Margin Waterfall Analysis solution brings the data, calculations, dimensional analysis and reporting required for a margin bridge into one connected planning environment.
MODLR supports margin waterfall analysis by connecting financial and operational data, modelling the drivers behind margin movement, analysing results across multiple dimensions, visualising the bridge and allowing teams to test potential actions before implementation.
Connect detailed financial and operational data
Margin analysis depends on current and consistent data. MODLR data integrations can bring information from ERPs, accounting platforms, databases, spreadsheets and other source systems into the planning environment.
This allows the analysis to connect units, realised selling prices, costs, product attributes, customers, suppliers and organisational structures rather than relying on disconnected extracts.
Model the drivers behind margin movement
MODLR can model the relationship between opening and closing gross margin and separate changes into volume, product mix, cost, selling price, markdown, promotion, shrinkage and other defined effects.
Because the calculations sit in the model, rather than in spreadsheets, finance can apply a consistent methodology across periods, scenarios and business units. The same logic supports actual-vs-actual, actual-vs-budget and forecast-vs-forecast analysis.
Analyse margin across multiple dimensions
MODLR enables businesses to explore the overall result across products, categories, suppliers, customers, stores, channels, entities and periods with dimensional profitability modelling. This helps finance move from a group-level margin movement to the parts of the business responsible for it.
For example, management can investigate whether:
- Margin leakage is concentrated in one product family
- Supplier cost increases have been recovered through pricing
- A channel is creating volume but weakening mix
- Promotions are producing profitable incremental demand
- Specific stores or regions have higher markdowns or shrinkage
Visualise the bridge and investigate the detail
MODLR Workviews and Cards can present margin waterfalls, management reports and role-specific views connected to the underlying model. Users can move from the headline result into the relevant drivers and dimensions without maintaining separate reporting datasets.
This connects the analysis with management reporting in MODLR, helping finance explain not only what happened but what requires management attention.
Test actions before they are implemented
Once the drivers are visible, teams can use scenario planning in MODLR to evaluate alternative assumptions before decisions are implemented.
A scenario may test:
- A proposed selling-price increase
- A different product or channel mix
- Supplier cost changes
- A revised promotion plan
- Lower markdown or shrinkage rates
- The effect of discontinuing low-margin products
This connects historical explanation with forward-looking planning. Rather than treating the waterfall as a month-end chart, the organisation can use it to assess how proposed actions may change revenue, gross profit and margin.
From margin reporting to margin management
Traditional margin reporting concludes with a percent and brief comment. Margin management does more.
It creates a repeatable process in which the business:
- Connects detailed financial and operational data
- Reconciles the movement in gross profit and gross margin
- Identifies the products, customers, suppliers, stores or channels responsible
- Distinguishes controllable, structural and one-off effects
- Tests the likely outcome of pricing, sourcing, assortment and promotional actions
- Assigns owners and monitors whether those actions improve margin
This turns the monthly number into a business reaction loop. Finance contributes the economic reason, while sales, procurement, ops, merchandising and management add the context and actions.
Conclusion
Gross margin can change for many reasons at the same time. A favourable price movement can be offset by higher costs. Volume growth can be undermined by weaker product mix. Promotions can generate revenue while destroying gross profit.
Margin waterfall analysis separates these effects and reconciles them to the reported result. It gives finance and management a clearer view of what changed, where margin is being gained or lost, and which actions deserve attention.
MODLR helps organisations move beyond a static margin chart by connecting detailed data, driver calculations, multidimensional analysis, reporting and scenario planning in one environment.
Explore MODLR’s Margin Waterfall Analysis solution to see how your organisation can explain gross margin movements and turn the findings into better commercial decisions.
Frequently asked questions (FAQs)
What is a margin waterfall analysis?
Margin waterfall analysis explains the movement from an opening gross margin to a closing gross margin by separating the change into drivers such as volume, product mix, selling price, cost, promotions, markdowns and shrinkage.
Is a margin waterfall the same as a gross margin bridge?
The terms are commonly used for the same type of analysis. “Gross margin bridge,” “margin bridge analysis” and “gross margin variance waterfall” all describe a reconciliation of the change in gross margin between two periods, scenarios or business units.
What is the difference between a margin waterfall and a price waterfall?
A margin waterfall explains the change in gross margin between two positions. A price waterfall traces the deductions between list price and the net or realised price. Price realisation may be one component of a broader margin waterfall.
What is the difference between margin waterfall analysis and price-volume-mix analysis?
Price-volume-mix analysis normally separates revenue or profit change into price, volume and mix effects. A margin waterfall may include those effects but can extend the bridge to cost, promotions, markdowns, shrinkage, rebates, foreign exchange and other business-specific drivers.
Can revenue increase while gross margin declines?
Yes. Revenue may grow because of additional volume, but gross profit can fall if sales shift towards lower-margin products, unit costs rise, realised prices decline or promotions and markdowns increase.
Should a margin waterfall use gross profit or gross margin percentage?
It can use either or show both. A gross-profit-value bridge explains the currency impact of each driver. A margin-percentage bridge explains the change in the gross margin rate. Finance should define and document the calculation method because percentage-point bridges require careful treatment of the changing revenue denominator.
How often should a margin waterfall be updated?
The frequency should match the speed of the business and the decisions being made. Monthly analysis may be sufficient for some organisations, while retailers, distributors and businesses facing rapid price or cost changes may benefit from weekly or more frequent monitoring.
Which industries benefit from margin waterfall analysis?
The approach is useful wherever price, volume, mix and cost interact across a varied portfolio. This includes retail, FMCG, manufacturing, wholesale distribution, consumer products and other product- or transaction-based businesses.
Can margin waterfall analysis identify margin leakage?
Yes. It can identify whether margin is being lost through pricing, discounts, unfavourable mix, cost increases, promotions, markdowns, shrinkage or other effects. Dimensional analysis then shows where the leakage is concentrated.
Can margin waterfall analysis be completed in Excel?
Yes, particularly for an initial or limited analysis. However, frequent refreshes, detailed dimensional analysis, changing hierarchies and multiple data sources can make spreadsheet-based waterfalls difficult to maintain, reconcile and scale.
How are dimensional profitability modelling and margin waterfall analysis related?
Dimensional profitability modelling shows where profit is generated or lost across products, customers, channels, locations and other business dimensions. Margin waterfall analysis explains why margin changed between two periods or scenarios by separating the effects of volume, product mix, selling price, costs, promotions, markdowns and shrinkage.
Used together, they allow businesses to identify which areas are underperforming and understand the specific drivers behind the change. Learn more in our guide to dimensional profitability modelling in MODLR.
Turn margin insights into action with MODLR
MODLR helps finance and business teams move beyond static margin reporting. With connected financial and operational data, organisations can analyse how price, volume, product mix, costs, promotions, markdowns and shrinkage affect gross margin across products, customers, suppliers, stores and periods.
- Explore MODLR Margin Waterfall Analysis to see how your business can identify margin leakage, investigate performance changes and make more informed pricing, sourcing and commercial decisions.
- Request a MODLR demo or contact the MODLR team to discuss your margin analysis, profitability modelling and planning requirements.