A profitable business can still run short of cash. Three-way forecasting connects the income statement, balance sheet and cash flow statement to show how business decisions affect your profitability, liquidity and financial position. This guide explains how to build, review and automate a connected three-way forecast for your business.
What is in this guide to three-way forecasting
- Executive summary
- Introduction
- What is three-way forecasting?
- Three-way forecasting use cases
- What period should a three-way forecast cover?
- How often should a three-way forecast be updated?
- Why is three-way forecasting essential to forward planning?
- How does scenario planning improve a three-way forecast?
- How to prepare a three-way forecast
- Consolidating a three-way forecast
- Three-way forecasting in Excel: benefits and limitations
- Why should we automate three-way forecasting?
- Reporting and monitoring a three-way forecast
- Using variance analysis to monitor the forecast
- How MODLR supports three-way forecasting
- Frequently asked questions (FAQs) about three-way forecasting
- Want to see MODLR’s three-way forecasting in action?
Executive summary
Three-way forecasting connects an organisation’s profit and loss statement, balance sheet and cash flow statement in one integrated financial model. When assumptions such as sales, costs, working capital, capital expenditure or borrowing change, the effects of those changes flow through all three statements.
Three-way forecasting gives businesses a forward-looking view of profitability, cash, assets, liabilities and funding needs. It also shows why forecast profit may not necessarily translate directly into cash.
A reliable three-way forecast begins with reconciled historical data and clearly defined business drivers. Finance teams can use this to forecast revenue and expenses, working capital, fixed assets and financing before completing and validating the balance sheet and cash flow statement.
Scenario planning in three-way forecasts can compare base, upside, downside and stress cases. Regular updates and variance analysis help management respond when actual performance or assumptions change.
Three-way forecasts can be built in Excel. However, the spreadsheet models become difficult to manage when they grow complex by adding many users, business entities, scenarios and data sources.
MODLR brings data and forecasting logic for the three-way forecast into one platform. It automates workflows, consolidates entities and provides role-specoific planning and report access to users.
Introduction
We evaluate the merits of a business plan through projected revenue and profit. But profit alone does not show whether customers will pay on time, whether growth will absorb more working capital, or whether the business will have enough cash to fund investment and meet its obligations.
Three-way forecasting connects profit, cash flow and the balance sheet to provide a complete view of the business. It helps finance teams, executives and operational managers see how decisions may affect funding needs, financial risks and future opportunities.
What is three-way forecasting?
Three-way forecasting is a financial planning method that links an organisation’s profit and loss statement, balance sheet and cash flow statement in one integrated model.
When an assumption changes, all three statements get updated. This shows how changes in assumptions affect profit, cash, assets, liabilities and funding needs.
Also called three-statement forecasting, a three-way forecast helps answer three related questions:
- Will the business make a profit?
- Will it generate enough cash to meet its obligations?
- What will its financial position look like at the end of the forecast period?
Historical financial statements explain what has already happened. A three-way forecast looks forward, showing how strategic and operational plans may affect future financial performance and position of the business. .
Key points to remember about three-way forecasting
- A three-way forecast connects the income statement, balance sheet and cash flow statement.
- Changes to revenue, costs, working capital, capital expenditure and financing flow through all three statements.
- It shows whether forecast profits are likely to translate into cash.
- It helps identify future funding requirements, liquidity pressure and balance-sheet risks.
- Different assumptions made can be tested through base, upside, downside and stress scenarios.
- An integrated forecasting platform can reduce spreadsheet errors, manual consolidation and version-control problems.
Let us now get an understanding of how three-way forecasts work.
What are the three parts of a three-way forecast?
They are:
1. The income statement, also called the profit and loss statement or P&L, forecasts revenue, expenses and profit over a particular period.
It shows whether the business is expected to make a profit or loss and what is driving that result.
2. The balance sheet forecasts the organisation’s assets, liabilities and equity at a particular date.
It shows how business activity, investment, borrowing and profitability may change the organisation’s future financial position.
3. The cash flow statement forecasts how cash will move into and out of the business.
It explains how operating activity, investment and financing decisions affect the organisation’s cash position, even when the timing of cash movements differs from the recognition of revenue and expenses.
How do these three financial statements connect?
A three-way forecast is valuable because the three statements are not prepared independently. They are connected through shared financial relationships.
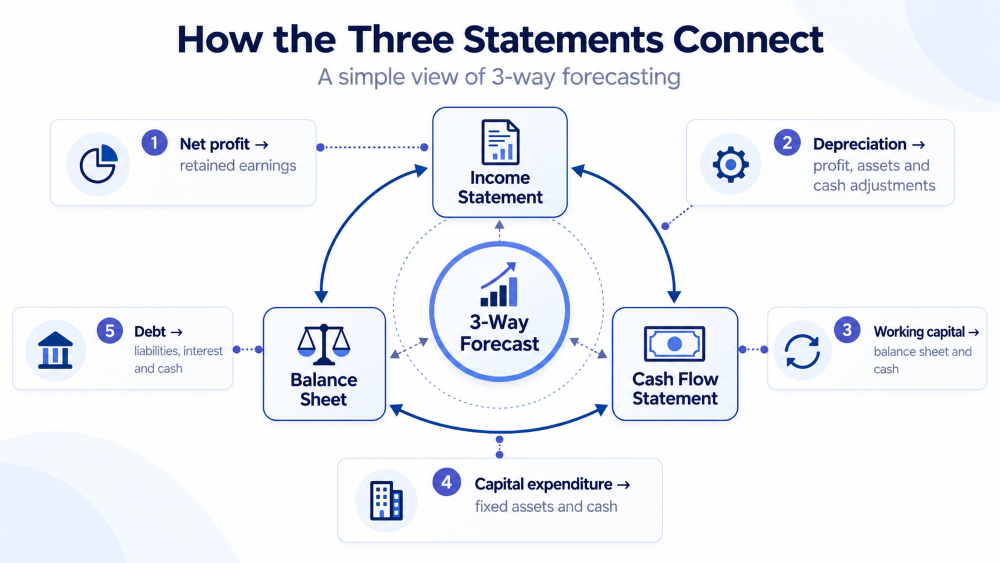
For example:
- Net profit from the income statement contributes to retained earnings on the balance sheet.
- Depreciation decreases both accounting profit and the value of fixed assets. However, it is added back when determining operating cash flow, as it is a non-cash payment.
- When a company receives payment from its customers will impact both accounts receivable on the balance sheet and the timing of cash inflows.
- Timing of supplier payments affects accounts payable and cash outflows.
- Inventory purchases and sales affect cost of goods sold, inventory balances and cash requirements.
- Capital expenditure increases fixed asset balances and creates a cash outflow.
- New borrowings increase cash and liabilities.
- Interest expense affects profit, while repayment of loan principal reduces both cash and debt.
- Tax expense and tax payment may not occur in the same period, so there is a direct effect on profit, liabilities and cash.
If modeled correctly, when one assumption changes the entire forecast through all three statements updates automatically.
Here's a core validation check:
Forecast assets must equal forecast liabilities plus forecast equity.
If the projected balance sheet does not balance then the model has an error, an incomplete link or an incorrect assumption.
An example in three-way forecasting
A business makes a $100,000 credit sale with a gross profit of $40,000.
The sale adds revenue and profit in the income statement. The unpaid amount adds to accounts receivable in the balance sheet. Cash is not increased until the customer pays. This is the reason forecast profit and forecast cash differ.
What Is the difference between a budget, cash flow forecast and three-way forecast?
This table explains the differences between a budget, cash flow forecast and a three-way forecast.
A three-way forecast can also operate as a rolling forecast.
The three-way model determines what is connected, while the rolling forecast determines how regularly the planning horizon is updated and extended.
Why is three-way forecasting important?
A three-way forecast serves many purposes.
It helps you see whether profits will translate into cash and provides insight into the key business drivers. It helps forecast your working capital needs and thereby reduces uncertainty. It serves as a good foundation for building a sound business plan. A three-way forecast can also be used to evaluate strategic and long-term decisions and to identify funding and covenant risks. It also offers a way to provide more credible information to Boards, business lenders and investors.
Let us explore how.
Shows whether profit will translate into cash
A business can report a profit while still facing a cash shortage.
This may happen because customers have not yet paid, inventory has increased, debt must be repaid or significant capital expenditure has taken place. A three-way forecast exposes the difference between accounting profit and available cash.
Help understand the key business drivers
Creating a three-way forecast requires businesses to identify the operational and financial factors that drive results. Driver-based forecasting connects these drivers directly to projected financial outcomes.
These may include:
- Sales volumes
- Product prices
- Customer numbers
- Gross margins
- Employee headcount
- Labour hours
- Production capacity
- Inventory levels
- Customer payment periods
- Supplier payment periods
- Capital expenditure
- Interest rates
- Foreign exchange rates
Understanding how these various drivers interact will improve the quality of financial planning and business decision-making.
To forecast working capital requirements
Business growth can increase revenue and profit while placing additional pressure on cash.
Higher sales may need more inventory, larger customer receivable (debt) balances and greater spending before the related cash can be collected. A three-way forecast helps the finance team estimate how much working capital the business will need to support its plans.
Reduces uncertainty
All business decisions involve uncertainty. Although forecasting cannot eliminate that uncertainty, it can show a range of possible outcomes.
Instead of waiting to see results after decisions have been implemented, with three-way forecasting decision-makers can identify potential cash shortages, margin pressure, debt requirements and balance-sheet risks in advance. This gives them more time to prepare and respond.
Helps build more robust business plans
A three-way forecast acts as a financial dry run of a business plan.
It can show how potential decisions may affect revenue, expenses, profit, cash, assets, liabilities and funding requirements over time. Management can then review the likely results and adjust the plan before committing resources.
Helps to evaluate strategic and long-term decisions
Three-way forecasts can be used to assess various aspects of a business in order to make more data-driven, calculated long-term decisions. They can be useful for evaluating the viability of:
- Business expansion
- Warehouse or production automation
- New locations
- Acquisitions
- New products and markets
- Major recruitment plans
- Capital investment
- Debt funding
- Changes to customer or supplier terms
Instead of evaluating a decision only through its effect on profit, the business can assess its complete financial impact.
To identify funding and covenant risks earlier
A three-way forecast can reveal when the organisation may require additional borrowing or when its existing debt position could become difficult to sustain.
It can also help management to assess:
- Interest expense
- Debt repayments
- Minimum cash requirements
- Leverage
- Debt service capacity
- Covenant headroom
- Dividend capacity
Provides more credible information to Boards, lenders and investors
Boards, lenders and investors may request three-way forecasts when evaluating business plans, borrowing proposals, capital investments or expansion projects.
A connected forecast provides greater visibility than a profit projection alone as it demonstrates how assumptions translate into cash flow and the future financial position of the organisation.
Who uses three-way forecasting?
Three-way forecasts may be used by:
- CFOs and finance teams
- FP&A professionals
- Business owners
- CEOs, Boards and executive teams
- Operational managers
- Project managers
- Banks and other lenders
- Investors and private equity firms
- Financial advisers and accountants
Different users may focus on different aspects and results. Finance may examine cash, working capital and debt; operational managers may focus on volumes, capacity and costs; while boards and investors may concentrate on profitability, liquidity, risk and return.
Three-way forecasting use cases
Here are some examples of how different businesses in a number of industries use three-way forecasts:
Three-way forecasting in manufacturing
A manufacturer models production volumes, raw material prices, labour requirements, inventory, equipment purchases and customer payment timing.
The forecast shows how these drivers affect margins, working capital, debt and cash.
Potential actions and decisions: Management may decide to adjust production volumes, renegotiate supplier or customer payment terms, reduce inventory, delay equipment purchases or arrange additional working-capital finance.
Three-way forecasting in the retail Sector
A retailer evaluates new-store openings, seasonal inventory purchases, supplier terms, lease commitments and projected sales.
This helps management determine when additional cash or financing may be required.
Potential actions and decisions: Management may approve, postpone or phase a store opening depending on the three-way forecast. They may also decide to reduce initial inventory, renegotiate lease or supplier terms, or secure financing before expansion begins.
Three-way forecasting in logistics
A logistics operator connects freight volumes, fuel prices, fleet investment, maintenance costs, customer payment periods and loan repayments.
The three-way forecast shows how operational changes affect profitability and liquidity.
Potential actions and decisions: Management may decide to revise freight rates, prioritise profitable routes or replace inefficient vehicles. They might also renegotiate loan terms or delay their fleet investment until cash flow improves.
Three-way forecasting in professional services
A professional services firm connects employee numbers, utilisation, billing rates, salary costs and customer payment timing.
This helps show the difference between revenue earned, invoices issued and cash collected.
Potential actions and decisions: Management may decide to delay recruitment and improve employee utilisation. They may take various operational measures including increasing billing rates, invoicing more frequently or introducing tighter customer payment terms.
Three-way forecasting in the construction industry
A construction business uses three-way forecasts for project milestones, progress claims, retention amounts, subcontractor payments, equipment costs and project financing.
This provides them a clearer picture of cash requirements across long and uneven project cycles.
Potential actions and decisions: Management may decide to renegotiate progress-payment schedules and arrange project financing. They could also delay equipment purchases, increase cash contingencies or reconsider taking on projects with unacceptable funding gaps.
Three-way forecasting in higher education
A higher education institution models student enrolments, tuition revenue, grants, staffing requirements and campus investment.
It can then assess the effects on operating results, cash reserves and assets.
Potential actions and decisions: Management may adjust recruitment, phase campus investment, revise programme intake targets, seek grant or debt funding, or redirect resources towards programmes with stronger demand and financial outcomes.
These examples show that three-way forecasting is useful across industries and for businesses of any size. Whether an organisation is managing growth, investment, working capital or funding, getting an across-business view that connects profit, cash flow and the balance sheet can help leaders and managers to make better-informed decisions.
What period should a three-way forecast cover?
The period that a three-way forecast covers depends on the purpose of the forecast and the nature and needs of the business.
Many businesses prepare monthly forecasts covering the next 12 to 18 months. Project related forecasts may cover three to five years. Longer-term strategic plans may call for longer periods. Usually these often use monthly detail in the near term and quarterly or annual periods further into the future.
In setting the three-way forecast period for your business, consider these factors:
- Cash-flow volatility
- Debt maturity dates
- Capital expenditure
- Project duration
- Seasonal trading patterns
- Investor or lender requirements
- The organisation’s strategic planning cycle
A forecast prepared for a specific project should normally cover the period required to show its investment, operating, funding and repayment effects.
How often should a three-way forecast be updated?
Again it depends on your needs. Three-way forecasts may be updated monthly, quarterly or annually, depending on their purpose.
Operational forecasting - For regular management purposes, the forecast may be updated monthly or quarterly as and when new actual results become available.
Strategic planning - Longer-term forecasts should be reviewed whenever significant (material) assumptions change. This is particularly relevant for those concerning growth, pricing, inflation, interest rates, foreign exchange or investment.
Funding and investment - Forecasts prepared for lenders or investors may need to be updated at agreed intervals or when there is a significant change in business conditions.
Rolling three-way forecasting A rolling forecast extends the planning horizon as each reporting period closes.
For example, when one month is completed, actual results replace the forecast for that month and another forecast month is added at the end. This keeps management’s forward view current.
Why is three-way forecasting essential to forward planning?
Every financial forecast is based on assumptions. Those assumptions may change as markets, costs, customer preferences, behaviour, technologies and economic conditions evolve.
A number of factors can affect a forecast:
- Inflation
- Interest rates
- Foreign exchange rates
- Wage growth
- Energy and freight costs
- Economic growth
- Customer demand
- Technology adoption
- Supply-chain disruption
- Changes in laws or taxes
- Competitor activity
This is because changes in one factor may affect several parts of the business simultaneously.
For example, an exchange-rate movement could increase imported material costs and reduce margins. It could also increase inventory funding requirements and place pressure on cash. A three-way forecast allows these effects to be assessed together rather than in separate calculations.
Geopolitical and economic disruptions can also affect energy prices, transport costs, supply chains, inflation and interest rates at the same time. Scenario-based three-way forecasting helps organisations prepare for a range of possible outcomes.
How does scenario planning improve a three-way forecast?
Scenario planning allows finance teams to test how different combinations of drivers affect profitability, liquidity and financial position.
A business may compare:
- Base case - The outcome based on current management expectations.
- Upside case - A stronger result based on assumptions such as higher volumes, better margins, faster customer collections or lower costs.
- Downside case - A weaker result based on lower demand, higher costs, delayed customer payments or reduced margins.
- Stress case - A more severe scenario involving substantial revenue pressure, major exchange-rate movements, supply disruption or significantly higher interest costs.
Each scenario should use the same underlying financial logic and update all three statements.
These will be some useful comparison measures:
- Revenue
- EBITDA
- Net profit
- Closing cash
- Working capital
- Debt
- Interest expense
- Covenant headroom
- Return on investment
- Dividend capacity
Scenario planning helps management navigate uncertainty and identify which actions may be needed under different conditions.
How to prepare a three-way forecast
Preparing a reliable three-way forecast calls for more than projecting revenue and expenses. Each supporting schedule must connect logically to the income statement, balance sheet and cash flow statement so that changes in one area flow through the complete model.
The process begins with accurate historical data and clearly defined assumptions. It then moves through revenue, working capital, capital expenditure and financing before completing and validating the three financial statements.
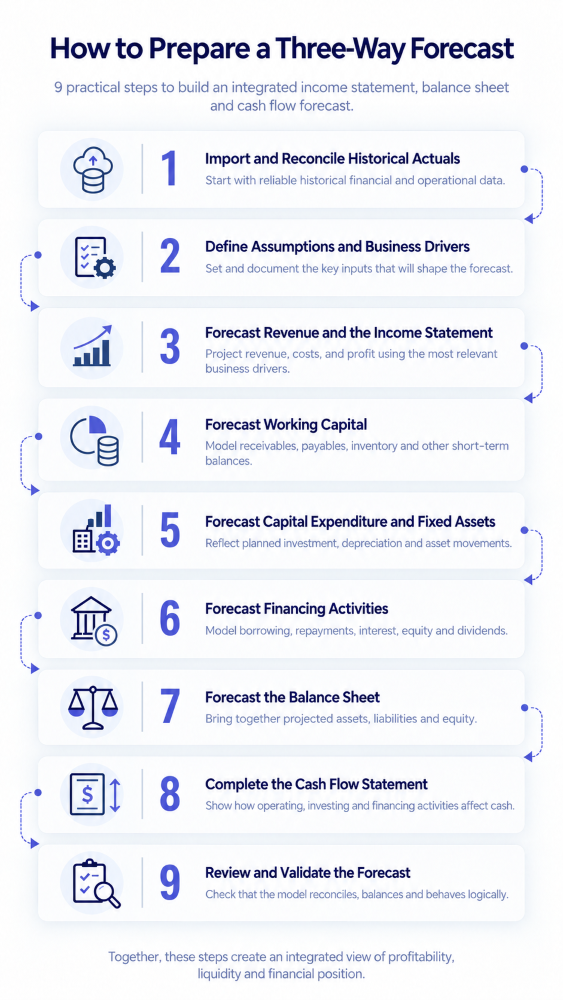
The nine main steps to make a three-way forecast are:
- Import and reconcile historical actuals to establish a reliable starting point.
- Define assumptions and business drivers that will shape outcomes of the forecast.
- Forecast revenue and the income statement using the business drivers most relevant to the organisation.
- Forecast working capital to connect operating activity with future cash requirements.
- Forecast capital expenditure and fixed assets to reflect planned investments, depreciation and asset movements.
- Forecast financing activities including borrowing, repayments, interest, equity and dividends.
- Forecast the balance sheet by bringing together the projected movements in assets, liabilities and equity.
- Complete the cash flow statement to show how operating, investing and financing activities affect cash.
- Review and validate the forecast to confirm that the statements reconcile, assumptions are realistic and the model responds logically to change.
Together, these steps create an integrated view of expected profitability, liquidity and financial position.
Let us now look at each step in the three-way forecasting process in detail.
Step 1: Import and reconcile historical actuals
Begin with reliable historical financial information.
This will normally include:
- General ledger balances
- Trial balances
- Historical income statements
- Balance sheets
- Cash flow information
- Supporting operational data
The opening balance sheet should be reconciled before the forecast begins. Historical data may be obtained from accounting, ERP, payroll, CRM, database and operational systems.
Copying, pasting and reformatting data manually can be time-consuming and exposes the process to human error. Data integrations can make actual results easier to refresh and reconcile.
MODLR can bring together data from sources such as ERP, CRM, accounting systems, databases and Microsoft Excel. MODLR has over 50+ such integrations that can help speed up the process.
Step 2: Define assumptions and business drivers
Assumptions are the inputs that have been used to develop the forecast.
They should be based on the best currently available information. They need to be documented well so that forecasters, managers and decision-makers understand the basis on which projected results were produced.
Typical assumptions made in making a forecast can include:
- Sales volumes
- Prices and discounts
- Product mix
- Gross margins
- Employee headcount
- Salaries and wage increases
- Production capacity
- Inventory days
- Receivable days
- Payable days
- Capital expenditure
- Asset lives and depreciation
- Interest rates
- Tax rates
- Foreign exchange rates
- Debt drawdowns and repayments
What questions should you ask when setting assumptions?
Here are some pertinent questions to ask when setting assumptions for a three-way (or any other) forecast:
- What period does the forecast need to cover?
- Which operational and financial drivers have the greatest effect on results?
- Which assumptions are most uncertain?
- What changes in legislation, tax or economic policy may affect the forecast?
- How could customer preferences, demand or supplier behaviour change?
- What constraints exist in staffing, capacity, funding or technology?
- Which assumptions should be tested through alternative scenarios?
It is a mistake to allow assumptions to remain static and unquestioned merely because they were approved at the beginning of the planning cycle. It is necessary to review them when new information becomes available.
Step 3: Forecast revenue and the income statement
Forecast revenue using the drivers most relevant to the business.
You may model revenue by:
- Product
- Customer
- Sales channel
- Location
- Business unit
- Project
- Contract
- Student cohort
- Service line
Revenue drivers differ from business to business. They may include volume, price, customer numbers, capacity, utilisation, conversion rates or contract milestones.
Next, we need to forecast:
- Cost of goods sold
- Employee costs
- Operating expenditure
- Depreciation
- Interest
- Tax; and
- Net profit
Fixed and variable costs need to be separately shown where possible so the model can respond correctly when business volumes change.
Step 4: Forecast working capital
Working capital is central to the connection between profit and cash.
Forecast:
- Accounts receivable
- Accounts payable
- Inventory
- Accrued expenses
- Deferred revenue
- Tax liabilities
- Payroll liabilities
- Other current assets and liabilities
Receivables may be forecast using customer payment schedules or debtor days. Payables can be based on supplier terms, while inventory may be linked to sales, production and target holding periods.
A growing business may need to fund higher inventory and receivables before it receives cash from the sales. The forecast should make that requirement visible.
Step 5: Forecast capital expenditure and fixed assets
Consider how capital assets will change over the forecast period.
The model should include:
- New asset purchases
- Project timing
- Depreciation
- Asset disposals
- Leases
- Maintenance investment
- Expansion of business premises
- Replacement of machinery or equipment
Capital expenditure affects both the balance sheet and the cash flow statement. Depreciation affects the income statement and the carrying value of assets. However, it does not create a current-period cash outflow.
Inflation, exchange rates and supply-chain conditions may also affect the timing and cost of future capital investment.
Step 6: Forecast financing activities
Forecast how working capital, investment and expansion will be financed.
Financing activities you need to capture include:
- Opening debt
- New borrowing
- Principal repayments
- Interest expense
- Lease liabilities
- Overdraft or revolving credit use
- Equity contributions
- Dividends
- Minimum cash requirements
Financing schedules should connect directly with the balance sheet, income statement and cash flow statement.
Step 7: Forecast the balance sheet
The forecast balance sheet shows the organisation’s expected assets, liabilities and equity at the end of each forecast period.
It should incorporate the effects of:
- Profit and retained earnings
- Receivables
- Inventory
- Payables
- Fixed assets
- Depreciation
- Tax
- Debt
- Leases
- Dividends
- Equity movements
- Cash
Although the balance sheet appears after the income statement in this process, many of its supporting schedules are developed alongside the P&L rather than afterwards.
Step 8: Complete the cash flow statement
The cash flow statement shows where cash is expected to come from and how it will be used.
It normally divides cash movements into:
- Operating activities
- Investing activities
- Financing activities
Under the indirect method, the cash flow forecast begins with forecast profit. Then adjustments are made for:
- Non-cash items like depreciation
- Changes in receivables
- Changes in payables
- Changes in inventory
- Other working-capital movements
- Capital expenditure
- Borrowing and repayments
- Dividends and other equity transactions
The resulting closing cash balance should equal the cash balance that is reported on the forecast balance sheet.
Step 9: Review and validate the forecast
Completing the first version is not the end of the forecasting process. It is necessary to review and validate it.
Review the forecast to determine whether:
- The results appear realistic.
- The balance sheet balances.
- Closing cash reconciles across the statements.
- Debt balances agree with financing schedules.
- Retained earnings reflect profit and distributions.
- Depreciation agrees with fixed-asset schedules.
- Working-capital balances are consistent with operating assumptions.
- Tax expenses, payments and liabilities reconcile.
- Unexpected negative balances appear.
- Funding requirements are practical.
- The model behaves logically when assumptions change.
It is also important to ask these questions:
- Which among our assumptions have the greatest effect on the forecast?
- Which assumptions are the least certain?
- Are the projected results operationally achievable?
- Are cash and financing requirements acceptable?
- Does the forecast comply with lender or investor expectations?
- What actions could improve the projected outcome?
The purpose of reviewing a forecast is not simply to make it look more favourable. It is to ensure that it is logically consistent, properly connected and, therefore, useful for decision-making.
Consolidating a three-way forecast
Three-way forecasts can be consolidated. Groups with subsidiaries, divisions or multiple business entities may need to consolidate their three-way forecasts.
Consolidation involves combining forecast income statements, balance sheets and cash flow statements. During consolidation, you must account for:
- Intercompany revenue and expenses
- Intercompany receivables and payables
- Intercompany loans
- Ownership structures
- Minority or non-controlling interests
- Different currencies
- Different charts of accounts
- Different reporting structures
Preparing consolidated forecasts manually with spreadsheets becomes increasingly difficult as the number of entities, currencies and reporting periods grows.
You may need large numbers of files, repeated formula checks and manual elimination entries. In contrast, a connected planning platform can centralise entity submissions, consolidation logic and group reporting. And get it done fast, compared to the time consuming manual process.
The forecast consolidation structure should also reflect the organisation’s accounting and control requirements. This includes principles established by IFRS 10 Consolidated Financial Statements.
Three-way forecasting in Excel: benefits and limitations
Excel may be suitable for an initial or relatively simple three-way forecast. Finance staff find it familiar, flexible and gives them control over model design.
However, spreadsheet-based three-way forecasting can become increasingly difficult when:
- Several people must contribute assumptions.
- Numerous files or versions exist, an inevitability with Excel..
- Actual data must be imported repeatedly.
- Multiple entities or currencies have to be consolidated.
- Formula structures differ between business units.
- Many scenarios must be maintained.
- Changes are difficult to audit.
- Reports must be distributed to different stakeholders.
- The model contains complex and interdependent schedules.
- Forecasts must be refreshed frequently.
One of the biggest challenges is that errors in one formula can flow through all three statements without being immediately visible.
Most companies do not necessarily have to or wish to abandon Excel immediately. A connected planning platform can centralise data, model logic, workflows and governance while also allowing finance to continue using Excel for selected reporting, analysis and data-entry tasks.
When you choose MODLR as your connected planning platform, you can use the MODLR Excel integration to make things easy and hassle-free to work with Excel.
MODLR’s Excel Add-in helps users who still prefer to work in Excel due to familiarity.
Why should we automate three-way forecasting?
Automating the three-way forecasting process significantly reduces the time and effort involved in importing actuals, updating assumptions, running calculations, consolidating entities and producing reports.
Here’s what is possible with automation:
- The system automatically brings in updated data from connected sources on schedule.
- Recalculates the forecast when assumptions change.
- Applies the same forecasting logic across the business.
- Produces recurring reports without rebuilding them each time.
- Combines forecasts from multiple entities.
- Compares different scenarios side by side.
- Shows where actual results differ from the forecast.
- Gives each user access to the tasks and information relevant to their specific role.
- Keeps all changes traceable and controls who can view or edit the forecast.
Automation does not remove the need for professional judgement. Finance teams still need to decide which assumptions are appropriate, look into anomalies and interpret what the forecast means.
Automation delivers value by reducing repetitive work so that finance professionals can spend more time analysing results and providing advice to improve decision-making.
Reporting and monitoring a three-way forecast
A three-way forecast should not be prepared and then ignored. Finance and management teams must regularly compare actual results with forecast results and identify any material variances.
Here’s what needs to be included in this process:
- Revenue versus forecast
- Gross margin
- Operating expenditure
- EBITDA
- Net profit
- Receivable days
- Inventory days
- Payable days
- Operating cash flow
- Closing cash
- Debt
- Covenant ratios
- Capital expenditure
This is not an exhaustive list. You may add any other indicators that suits your organisation.
Resulting dashboards and management reports can help decision-makers identify developing trends, potential cash shortages, funding requirements and any significant deviations from plan.
Using variance analysis to monitor the forecast
Variance analysis compares actual results with budgeted or forecast results.
It can help answer questions such as:
- Why did actual revenue differ from forecast revenue?
- Did sales volumes, prices or product mix change?
- Why were costs higher or lower than expected?
- How did working-capital movements affect cash?
- Did customers pay more slowly than in the forecast?
- Did inventory levels rise faster than sales?
- How did actual capital expenditure compare with the plan?
- How did margins change across products, locations or business units?
- Does the forecast need to be updated?
Not every variance calls for the same level of attention. Finance teams can set materiality thresholds to focus on differences that may affect business performance, liquidity or decision-making.
How MODLR supports three-way forecasting
MODLR supports three-way forecasting by bringing together financial and operational data and connecting business drivers to the three financial statements. MODLR also automates forecast workflows, scenario comparisons and consolidating multiple entities. MODLR provides strong controls with role-specific planning and reporting and enable users to work on familiar Excel-based workflows. And most importantly, it strengthens governance through centralised data, controlled inputs and consistent model logic.
Let us look into exactly how MODLR can improve and support three-way forecasting in your business.
MODLR brings financial and operational data together
MODLR can bring financial and operational data from multiple sources into one planning environment.
This may include integrating data from:
- Accounting systems
- ERP platforms
- CRM systems
- Payroll and HR systems
- Databases
- Microsoft Excel
- Other operational applications
Centralising this information in this way reduces the need for repeated exports, copying and manual reconciliation.
MODLR builds one connected financial model
Revenue, operating expenditure, headcount, working capital, capital expenditure, financing and tax schedules can all be connected to the forecast P&L, balance sheet and cash flow statement.
When assumptions change, with MODLR, the related financial outcomes get updated across the model without having to maintain separate versions of each statement.
This way, the finance team has a shared source of forecast logic rather than a collection of disconnected spreadsheets.
MODLR uses driver-based forecasting
Operational drivers of your business can be linked directly to financial results using driver-based forecasting.
For example:
- Sales volumes drives revenue, production, inventory and receivables.
- Headcount drives salaries, payroll costs and cash payments.
- Capital investment drive asset values, depreciation, financing and cash.
- Customer payment terms drive receivables and liquidity.
- Interest rates can drive financing costs and debt service requirements.
This helps finance and operational managers understand how their areas of responsibility translate into financial outcomes of the business.
MODLR automates data and forecasting workflows
You can use scheduled processes to refresh actuals and supporting information. This reduces reliance on repeated manual imports.
Automated workflows can also support:
- Data preparation
- Model calculations
- Forecast updates
- Consolidation
- Report distribution
- Recurring management processes
This saves time and effort, and give finance professionals more time to analyse results instead of maintaining spreadsheets.
MODLR makes it possible to create and compare multiple scenarios
Businesses can create base, upside, downside and stress scenarios using the same underlying model, instead of repeatedly having to build new ones for each scenario.
Changing a key assumption used in building scenarios will automatically update their impacts across the income statement, balance sheet and cash flow statement. This helps decision-makers compare possible outcomes consistently.
MODLR consolidates results of multiple entities
MODLR can support forecasting across companies, divisions, cost centres, currencies and other reporting dimensions. MODLR’s financial close and consolidation solution can be useful whether your organisation has two entities or a complex group structure with entities spread across the globe with multiple currencies.
You can consolidate forecasts into a group view while still allowing decision-makers to analyse individual entities and business units.
MODLR enables role-specific planning and reporting
Finance teams, operational managers and executives do not always need to see or edit the same information.
Workviews and Cards enable MODLR to provide different users with views appropriate to their roles while drawing on the same underlying data and model logic.
For example:
- Department managers may enter operating assumptions.
- Finance teams may review statement connections and funding requirements.
- Executives may monitor profit, cash and risk indicators.
- Boards may receive a consolidated forecast and scenario comparison.
MODLR enables retaining Microsoft Excel as a familiar reporting interface
The MODLR Excel Add-in effectively turns Excel into a frontend for connected planning. This way, finance teams are able to continue using familiar spreadsheet-based reports while they remain connected to a central model.
This smoothens the transition from spreadsheets to connected planning by allowing users to retain selected Excel workflows without relying on multiple disconnected files.
MODLR improves governance and control
MODLR’s centralised model can provide more control compared to forecasts that are distributed via email and stored in separate spreadsheets.
Depending on model design and access settings, MODLR makes it possible for your company to establish:
- Defined ownership
- Controlled inputs
- Role-based access
- Consistent calculation logic
- Standard reporting structures
- Repeatable forecast processes
- Greater traceability
- Clearer review workflows
These controls become increasingly important as more users, entities and scenarios get added to the forecasting process when a business grows.
To sum up: MODLR helps connect profit, cash and financial position
Three-way forecasting connects profitability, liquidity and financial position in one forward-looking model.
It enables finance teams to see how operational decisions, working-capital movements, investment and financing choices affect the entire business, not just their impact on the income statement.
A three-way forecast becomes an ongoing management tool when supported by integrated data, clearly defined drivers, scenario planning and automated reporting. This is a big leap from a spreadsheet prepared just for an annual budget, lender or funding application.
MODLR helps organisations bring their financial and operational data together and connect the three financial statements. It supports scenario comparisons and multi-entity consolidation while enabling role-specific reporting from a shared planning platform.
Frequently asked questions (FAQs) about three-way forecasting
What is a three-way forecast?
A three-way forecast is an integrated financial forecast that connects the profit and loss statement, balance sheet and cash flow statement. It shows how operational and financial assumptions affect profitability, cash and the organisation’s future financial position.
What are the three parts of a three-way forecast?
The three parts are the profit and loss statement, balance sheet and cash flow statement. They are connected so that changes in revenue, expenses, working capital, investment or financing flow through the complete financial model.
Why can a profitable business experience a cash shortage?
Profit does not always translate directly into cash. A profitable business may experience cash pressure when customers pay slowly, inventory increases, debt must be repaid or significant capital expenditure takes place.
How do you validate a three-way forecast?
The forecast balance sheet must balance, while closing cash must reconcile across the cash flow statement and balance sheet. Working capital, debt, fixed assets, tax and retained earnings should also agree with their supporting schedules.
How far ahead should a three-way forecast cover?
Many organisations prepare monthly forecasts covering 12 to 18 months. Project and strategic forecasts may cover three to five years or longer. The appropriate period depends on cash-flow volatility, debt requirements, investment plans and business needs.
Can a three-way forecast be a rolling forecast?
Yes. A rolling three-way forecast replaces completed periods with actual results and adds new forecast periods. This maintains a consistent forward-looking view of profitability, cash flow and financial position.
Can you build a three-way forecast in Excel?
Yes. You can me relatively simple forecasts in Excel. However, data imports, version control, formula consistency, collaboration, scenario management and consolidation can become difficult as the number of users, entities and data sources increases.
See: Excel Replacement for FP&A: When Finance Teams Outgrow Spreadsheets
How does MODLR automate three-way forecasting?
MODLR can automate data imports, model calculations, forecast updates, workflows, consolidation and reporting. This reduces repetitive manual that goes into forecasting. It frees up time for finance teams to focus on reviewing assumptions, interpreting results and advising decision-makers.
Can MODLR create and compare three-way forecasting scenarios?
Yes. MODLR can create base, upside, downside and stress scenarios using the same underlying model. Decision-makers can compare how different assumptions affect revenue, profit, cash, working capital, debt and funding requirements.
Can MODLR consolidate three-way forecasts across multiple entities?
Yes. MODLR supports forecasting across companies, divisions, cost centres, currencies and other reporting dimensions. Forecasts can be consolidated into a group view while retaining the ability to analyse individual entities and business units.
Want to see MODLR’s three-way forecasting in action?
Schedule a MODLR demo today. Discover how MODLR can help your organisation build, automate and manage a connected three-way forecast.
Explore MODLR's planning and performance-management solutions.
Follow MODLR on LinkedIn and visit the MODLR YouTube channel for short guides, modelling demonstrations and user-group sessions.
Originally published: 30th May 2022